
Returns and Dupont
/Sorry. I found an error in my spreadsheet yesterday, and one that I should have easily fixed.
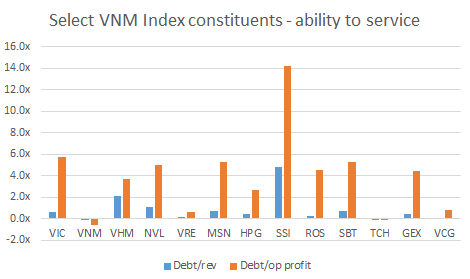
It turns out that my figure for debt at Vinamilk (VNM) was wrong. It was a simple excel error that I should have caught, especially because I thought the number looked weird. Make this be a lesson to you: when a number looks weird, check it!. The revised charts are here:

Source: Company data, Vietecon.com, Vietstock
Source: Company data, Vietecon.com, Vietstock
The big takeaway (besides my idiocy) is that VNM actually looks extremely safe. I have more to say about this in today’s post. I also checked my figures for SSI, and they are still correct. So that is the company with the lowest revenue and operating profit compared to debt. Basically, it is highly levered on most metrics.
Now to today’s post.
Because I have this (newly scrubbed) data set of companies, I also wanted to look at a returns, the other component of this growth in balance sheets.
At the same time balance sheets have grown, returns have falling. As we talked about yesterday, if returns fall, to keep the absolute profit level stable you need a bigger balance sheet. That balance sheet can be either equity (very safe) and debt (safe at low levels, unsafe at high levels).

Source: Company data, Vietecon.com, Vietstock.com
Looking at Vietnam, returns for the companies in our sample have a few facets:
Return on assets are much lower than return on equity. Think of return on assets as the weighted average of return on debt and the return on equity. Debt returns (to the lender) are lower than equity. Sometimes they are fixed. Generally, debt doesn’t get any upside but is supposed to be protected from downside, due to the equity buffer. (Losses flow to equity first).
Return on equity is 13.8% on average. At first, that seemed high, but looking at the S&P500, it actually is the same. That shocked me, although maybe it shouldn’t have. Also, I guess I’m easily shocked.

Assets/equity=RHS. Source: Vietecon.com
Finance professionals have come up with a neat method of breaking down the returns on equity. It’s called the DuPont analysis. Return on equity is just (net income/equity), and so let’s add a few terms, and break it into 3 parts: (net income/sales), (sales/assets), assets/equity). Cross out sales and assets, and you get back to net income/equity. Charts on the right show the DuPont figures for a few companies that I want to highlight.
The components of the RoE are a bit different in Vietnam than in the US - margins are lower in the US (16% net margin in Vietnam vs 9% for the S&P) and the equity multiplier, or assets/equity, is much lower 244% (VN) vs 470% (US). These basically counteract each other, resulting in a similar RoE.
The difference points to what Levy is talking about - in the US, returns have fallen, and balance sheets (assets) have gotten much larger. Look how much higher the black dot is for the S&P than for the VN average.
Vinamilk (VNM) is kickin’ butt and takin’ names. It’s mostly due to extremely high margins (19%) and asset turnover (136%). That means that the company makes very good use of its assets. If it buys something for $100, it gets $136 in revenue from it. Then it gets $26 in net income from it. The equity multiplier is pretty low at 140%.
Just for a second on that Vinamilk net margin - I was right, it is high compared to a quick survey of companies. Three in the US (LWAY, DF and KHC) all had losses last year. The one I know from Saudi, Al Marai, actually has quite high margins at 13.8% (2018), but it gets support from the government. And it is still low compared to VNM. [There is a whole story about chickens and Al Marai, but let’s not go there.]
No one else comes close, but Vinhomes and Masan Group are both over 20% RoE. Vinhomes surprises me more than Masan Group, because investment banks like Masan usually have a relatively low equity base and few assets. Vinhomes, though, should be extremely levered as a property developer, and it is. But it also has very high margins (25%).
Basically, compared to US (or US-listed) companies, Vietnamese listed companies have better margins, make better use of their assets and have lower leverage. That’s all to the good. Now I need to look at how this has changed over time, which might take a bit longer to do.
But before I go, I wanted to just touch on the original report and why I think it holds meaning for Vietnam, despite being focused on the US. From the report (page 5):
“Although the focus of this paper is on the U.S. economy, swelling private sector balance sheets relative to incomes and the consequent increase in the riskiness of financial behavior are global phenomena. In this business cycle, much of the most reckless risk taking by both U.S. and foreign investors and financial institutions is international but with direct implications for the domestic economy.”