
How did we do in 1H?
/The first half of the worst year ever recorded is finally finished. Unfortunately, the bad parts of 1H2020 are bleeding into the second half. Quick summary:
Source: Yahoo.com, chart by Vietecon.com
massive economic dislocation with hundreds of millions of people joining the unemployed or furloughed ranks
at least 500,000 deaths from COVID worldwide, and this likely undercounts the actual numbers considerable
trade has drastically fallen because of COVID but also because of underlying trade tensions (see: US vs China trade war)
massive protests against racial injustice in Western countries

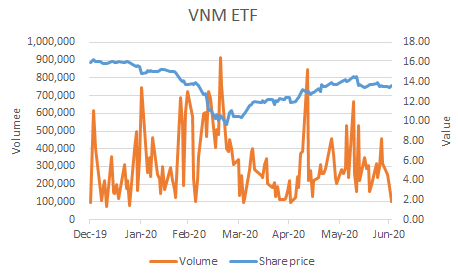
Source: Yahoo.com, chart by Vietecon.com
But looking at the stock market, you would be forgiven not to think that the world is collapsing. In fact, things don’t look that bad at all. For example, the S&P 500 is down just 3.5% since the beginning of the year and up 5% year-over-year.
The VNM ETF isn’t doing as well, down 15% since the beginning of the year and just a bit more year over year. The surprising thing about this is that the Vietnamese economy should be able to rebound much faster than the US economy, since there is no community spread and even to this day no deaths from COVID.

Source: Yahoo.com, Investing.com, chart by Vietecon.com
Another weird thing is that the actual stock market in Vietnam is not doing as badly as the ETF. The main index (VN Index, which is for the Ho Chi Minh Stock Exchange) is down 12%, compared to the 15% decrease for the ETF.
Remember there are a few things that determine the value of the ETF:
The exchange rate between the USD and the VND. Remember that the ETF is priced in dollars, but the majority of the stocks are priced in VND.

Source: Van Eck
The ETF NAV may not reflect the underlying assets. this usually gets arbitraged away. Say the NAV cost $100, but all the assets cost $90 (this would rarely happen), you buy the assets and sell the ETF and get $10 risk-free. When the market was closed in Vietnam but not in the US during Tet, we saw a severe dislocation in the ETF value, because people started to be (rightly) concerned that COVID would damage Vietnam’s economy. At that time, there was a significant discount (more than 10%) to the NAV value. That was because the NAV value reflected the last traded price on the Vietnamese exchanges, which were stale. It’s all very interesting, but now the premium/discount isn’t so big (-0.35% as of end June).

Source: Van Eck, chart by Vietecon.com
The ETF includes a number of assets that aren’t in Vietnam. See the pie chart on the right. Korea is extremely important at 23% of the index. Japan and Taiwan make up a bit more than 9%. There is a new holding, Jaks Resources Bhd from Malaysia, but it is still a very small amount of the index.
This points to the somewhat arbitrary nature of the index. It makes intellectual sense that company with lots of operations in Vietnam could be in the index, but if you told me that almost a third of the main Vietnamese ETF includes stocks outside of Vietnam, I would be very surprised.
Anyway, I want to explore more of first half performance, but I am running out of time. More tomorrow.