Property stocks
/Source: World Bank, Vietnamese GSO, chart by Vietecon.com
Following up on my Wednesday post, there is a lot of interesting things to look at within the property space in Vietnam. Remember, it makes up as much as a quarter of the stock market (although much of that is Vingroup). But even besides that, it is a good indication of what is happening in the real economy.
Although, if we examine that last statement a bit more using data, it turns out that construction is actually pretty small as a percentage of GDP, less than 7%. So in fact the real estate weighting in the stock market is disproportionately high compared to its weighting in the economy. I wonder if that is because exports are such a bit part of the economy in Vietnam. Not sure. Looking at the US, construction makes up just 4-5%. So maybe exports don’t explain it.
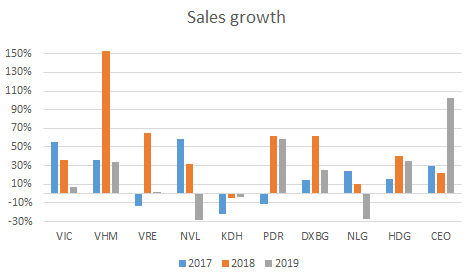
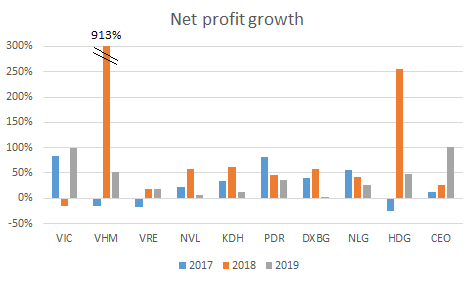
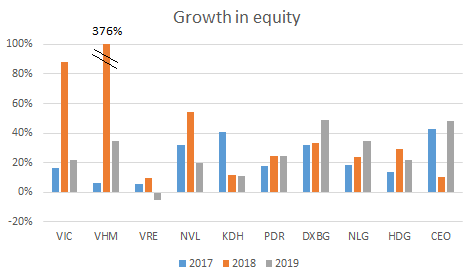
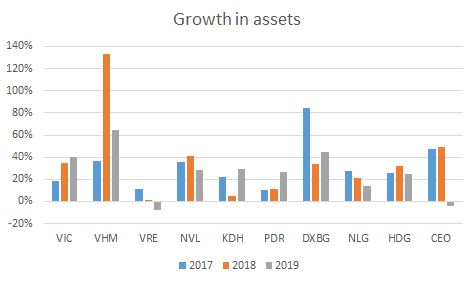
No matter, property is important to stock performance. Today, I am just going to throw a bunch of charts at you (scroll down to see all 6), to get a sense of how things have been trending. The biggest thing that I realized through this is that there is just a lot of variance and that you can’t really look at the companies as a group. Quick summary points:
VHM is really the outlier, because in 2018, the company had a massive increase in sales from VND15tr to VND39tr. That also resulted in a massive growth in net profit and equity. I haven’t looked into this sufficiently, but I would surmise that VHM delivered a big project then. Even outside of 2018, the company has shown solid growth in sales and mixed growth in net income.
Looking at the rest of the crew, sales growth is all over the place, but that’s no surprise. This is endemic in property developers, because sales depends on deliveries, and deliveries are lumpy. You usually deliver all at once when a development is finished, or at least within most of a year or spanning no more than 2 years. Unless it is an exceedingly large development. So you see some companies with tons of growth followed by a decline, or vice versa.
Net profit growth doesn’t always follow sales growth, which is important to know. Think of property companies as having massive operating leverage. In a down year, sales barely or don’t cover operating expenses. But then when deliveries are big, they swamp operating expenses.
Equity has been growing steadily, even in periods when net income isn’t growing. That’s very interesting. It could be because of lower liabilities, particularly as cash is received for projects.
Asset growth doesn’t match equity growth either, surprisingly. That speaks to the need to look at each individual company to really see what is happening.
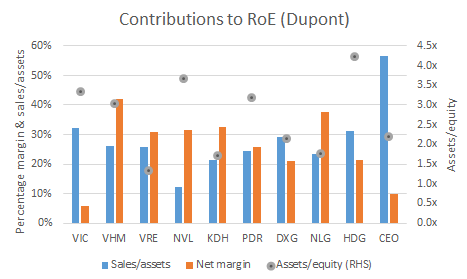
Looking at the Dupont equation components of RoE, there are some broad similarities. Sales/assets is about 26% on average (2019), and net margin is around 26%, with a standard deviation of 11-12% in each case. The companies are generally highly levered at 2.7x assets/equity, but that can really vary (standard deviation of almost 1.0x).
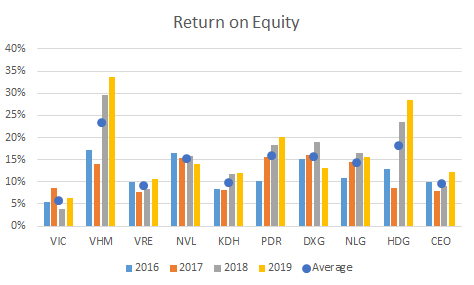
RoE also is all over the place, but that is mainly due to the Vingroup companies. Outside of them RoE averaged 12% in 2016-17 and 16% in 2018-19. And the standard deviation is almost cut in half. I don’t really buy that the Vingroup companies are different, but at least for RoE, it looks like they might be statistically different enough to matter.
I want to go into the implications of this a bit more and into a discussion of specific companies, but that will have to wait until next week.
Source: Company data, calcuations and charts by Vietecon.com


